top of page


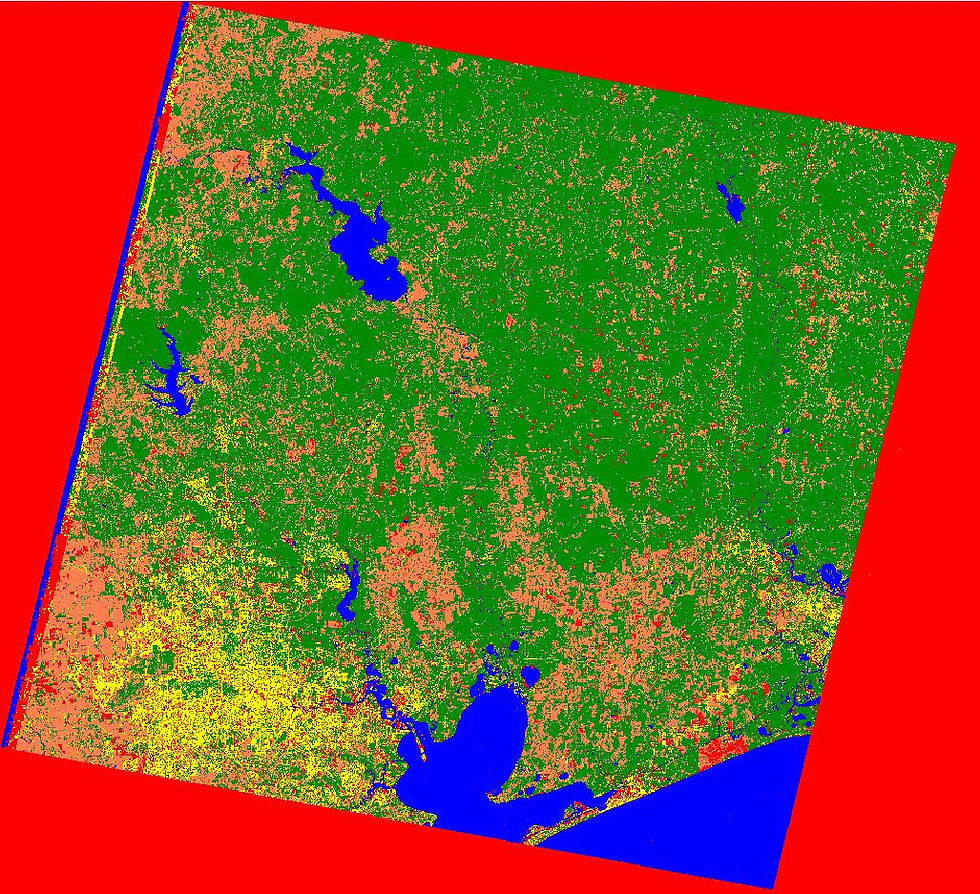


To your right is a slideshow of the used images for monitoring and analylzing the anthropogenic effects of Houston
 |
|---|
 |
 |
 |
To the left are images of the Change Detection when comparing the years 2000-2007, 2007-2015, and 2000-2015.
bottom of page